Essential App Metric Formulas That Every Mobile App Needs
Essential App Metric Formulas That Every Mobile App Needs

Hena
Hena
Nov 20, 2020
Nov 20, 2020
If you’re working with mobile apps, tracking the key mobile app metrics is crucial for your business’s success. But the big question is: which mobile app performance metrics matter the most? You'll find the answers in this artiicle.
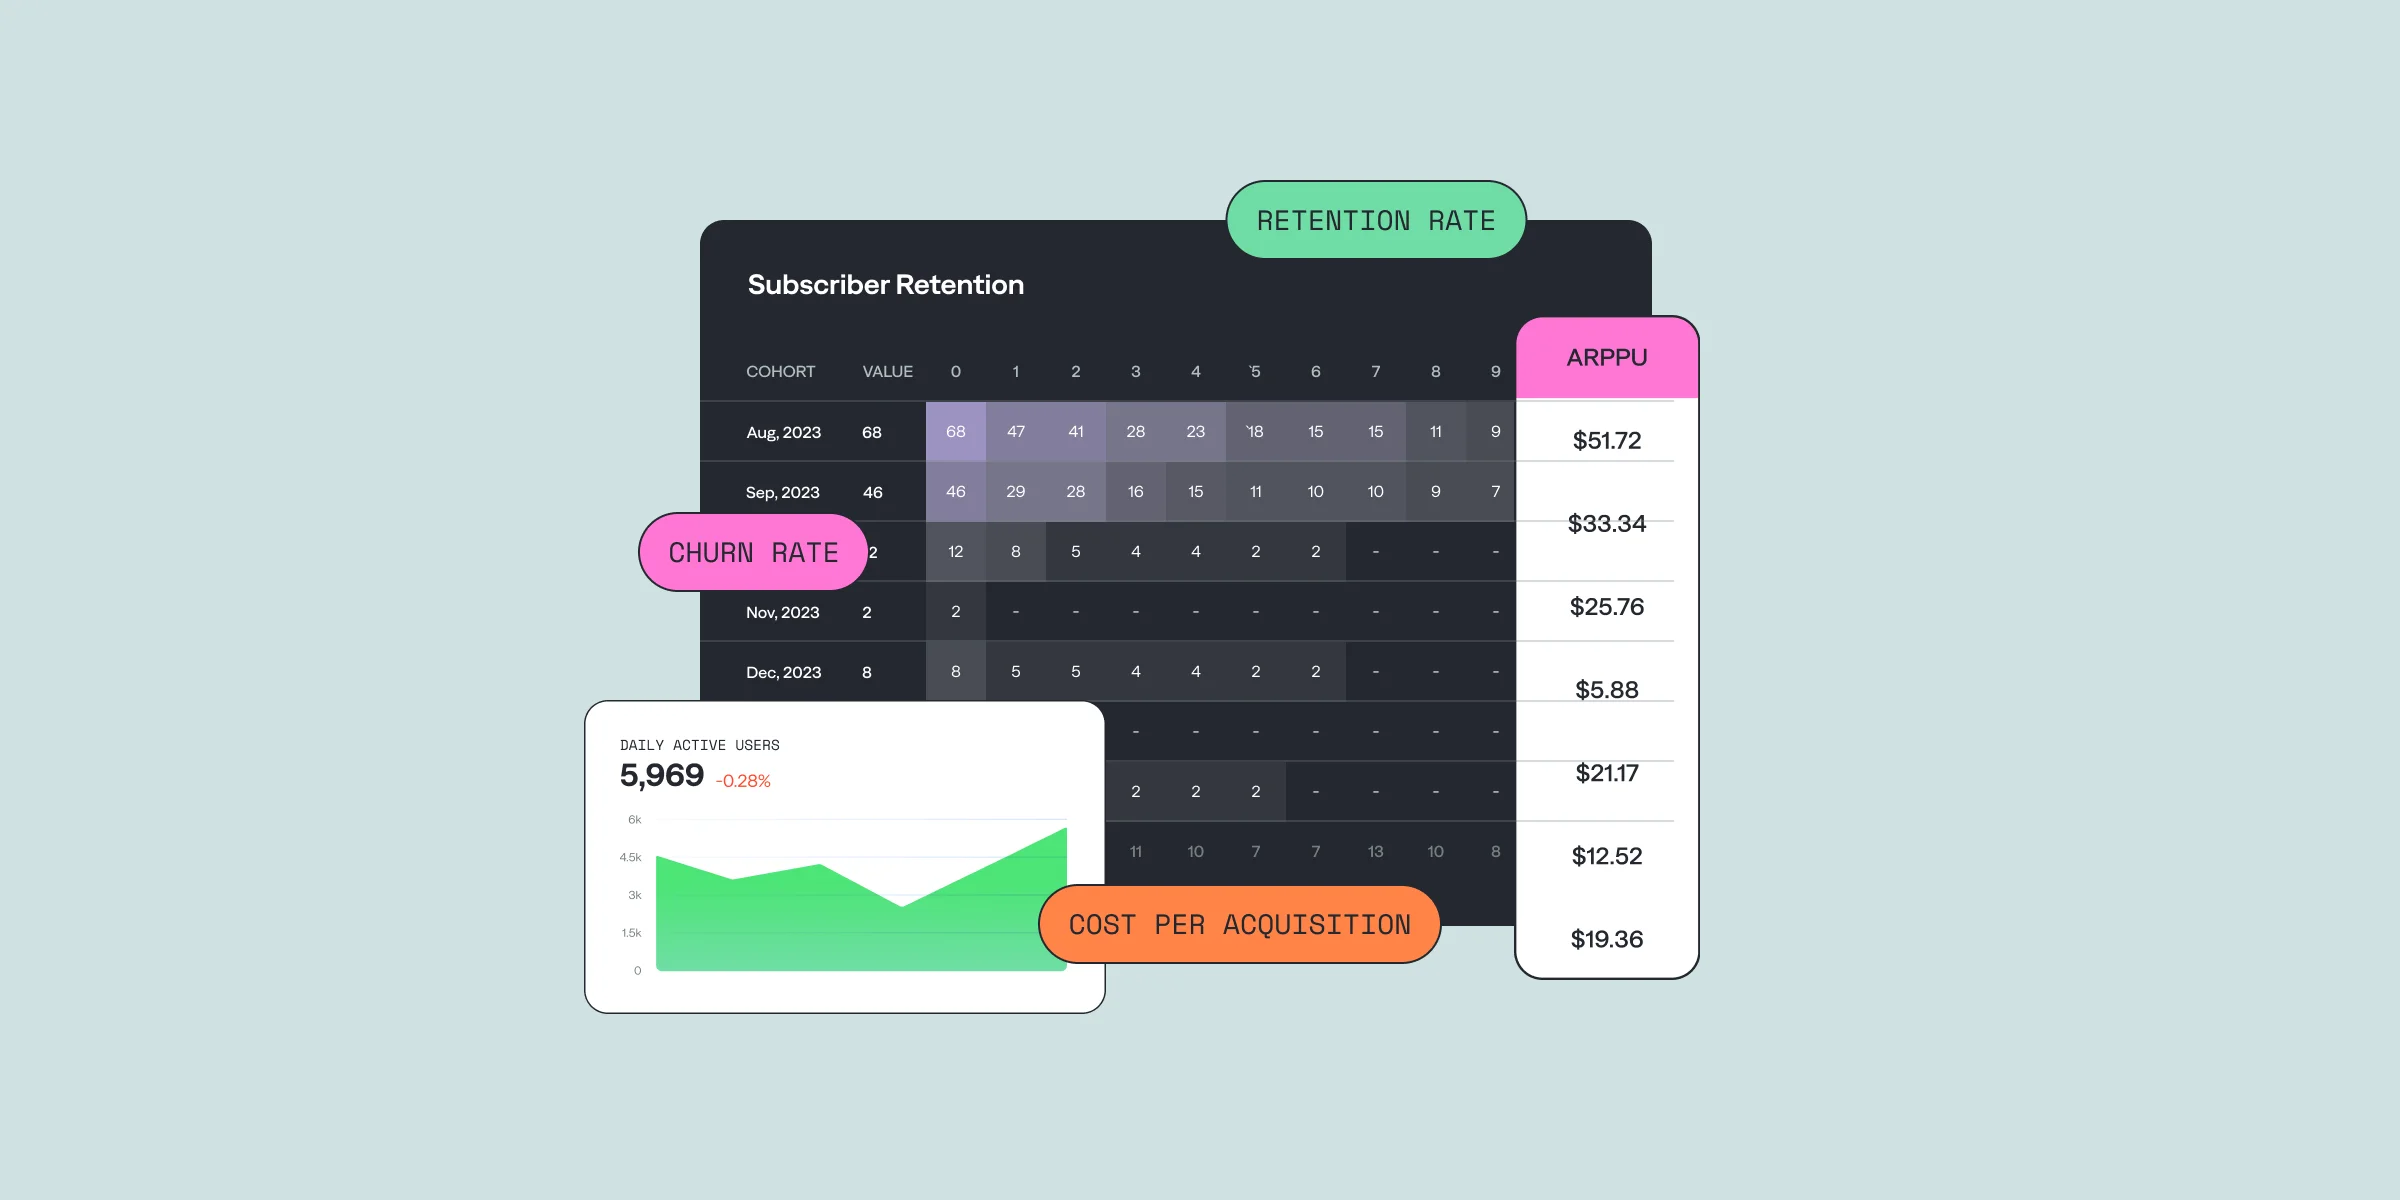
We’ve gathered the most essential mobile app performance metrics that will give you a clear picture of how your app is performing. By understanding these metrics, including app download metrics and in-app purchase metrics, you can fine-tune your strategies and boost customer retention. Whether it’s through a mobile app KPI dashboard or mobile app analytics, these will keep you on track.
If you’re working with mobile apps, tracking the key mobile app metrics is crucial for your business’s success. But the big question is: which mobile app performance metrics matter the most? You'll find the answers in this artiicle.
We’ve gathered the most essential mobile app performance metrics that will give you a clear picture of how your app is performing. By understanding these metrics, including app download metrics and in-app purchase metrics, you can fine-tune your strategies and boost customer retention. Whether it’s through a mobile app KPI dashboard or mobile app analytics, these will keep you on track.