Mobile App Subscription LTV The lifetime value of your app subscriber, or LTV, is how much revenue he provides while using your app. It’s essential to know your average client LTV to run effective marketing campaigns.
What is LTV?
The lifetime value of your app subscriber, or LTV, is the revenue he provides while using your app. Knowing your average client's LTV is essential to running effective marketing campaigns. The key is comparing LTV to customer acquisition cost (CAC). If a user provides more revenue than you spend to acquire him, you are earning money and should consider scaling your user acquisition to grow your business.
Usually, you have to pay for marketing upfront. Still, you collect revenue gradually when a client uses your service — and even more so with a subscription business model where you charge clients monthly, semiannual, or annual. That’s why looking at LTV estimates over a set period is essential. What are your users’ six-month LTV, one-year LTV, or two-year LTV? Depending on your capital, you need to decide what period is acceptable to break even and have a positive return on advertising spend.
Calculating LTV for a subscription business is pretty simple. The most important metric you need to know is your users’ retention.
Let’s say your app offers a monthly subscription. If you know precisely how many users will stay with the service each month after the initial subscription starts for the next 11 months, then how much you will earn in one year, you can calculate.
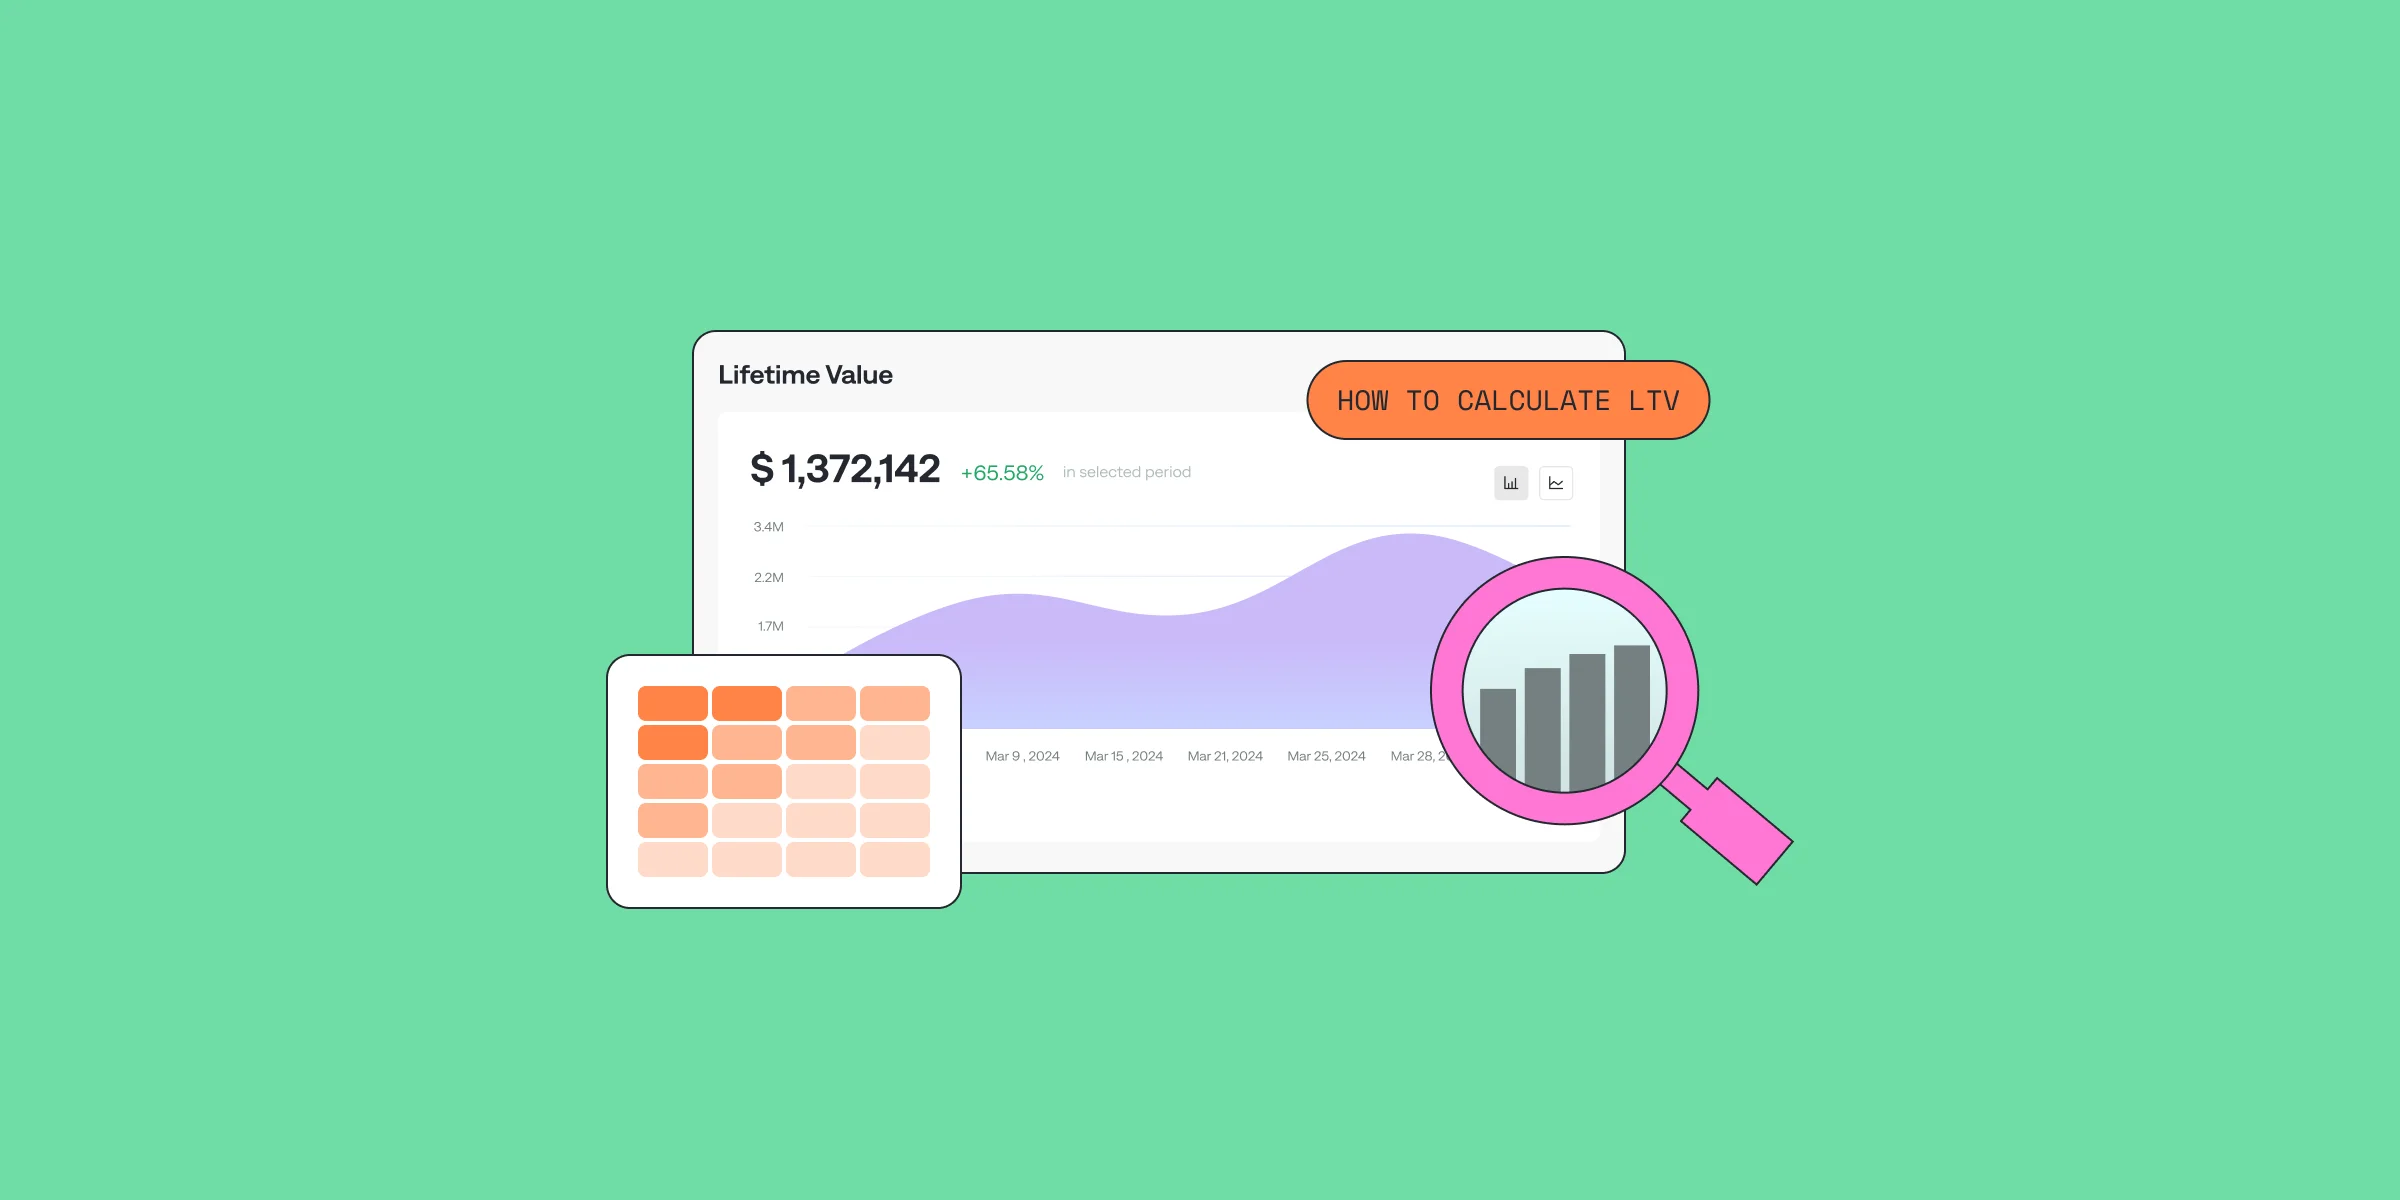
How to calculate LTV: Hypothetical Example
Let’s assume that the monthly price of your app’s subscription is $10, and you have acquired 100 users in the first month. Let’s assume that the user retention and the number of subscribers accordingly match the data in the table below:

With the monthly price of 10 dollars, you get the following monthly revenue values:
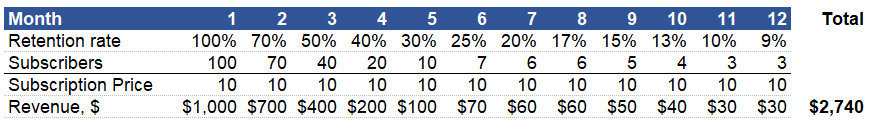
The total revenue for one year is $2,740. Your one-year LTV is the total revenue divided by the total number of users in the cohort: $2,740 / 100 = $27.
Now that you know a user brings you $27 in one year, you can compare it with your user acquisition cost. Let’s assume you can acquire subscribers for $20 with Facebook advertising campaigns. In this case, you earn $7 per subscriber in one year. It’s a profitable business: You earn $7 on $20 invested, so you should scale this acquisition channel.
Mobile Subscription Retention
From the calculation above, the real question is this: How do you get the retention numbers? With the fixed subscription price and the fixed subscription duration period, you have only one variable: retention.
For example, you can assume that churn every month, allowing you to quickly cal 20% of your speculate retention for each month.
The LTV Formula
The LTV formula is straightforward in that case:
LTV = Subscription Price / Churn Rate
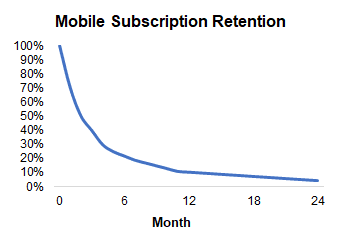
The problem is that the actual mobile subscription churn is not linear. In reality, users leave at a higher rate in the first months, and the more time passes, the slower the unsubscribe rate is. Usually, the retention curve has a steep decline at the beginning, flattens in the later months, and looks approximately like this:
You have two main options to get to the retention numbers to approximate this curve.
Retention Based on Actual App Store Data
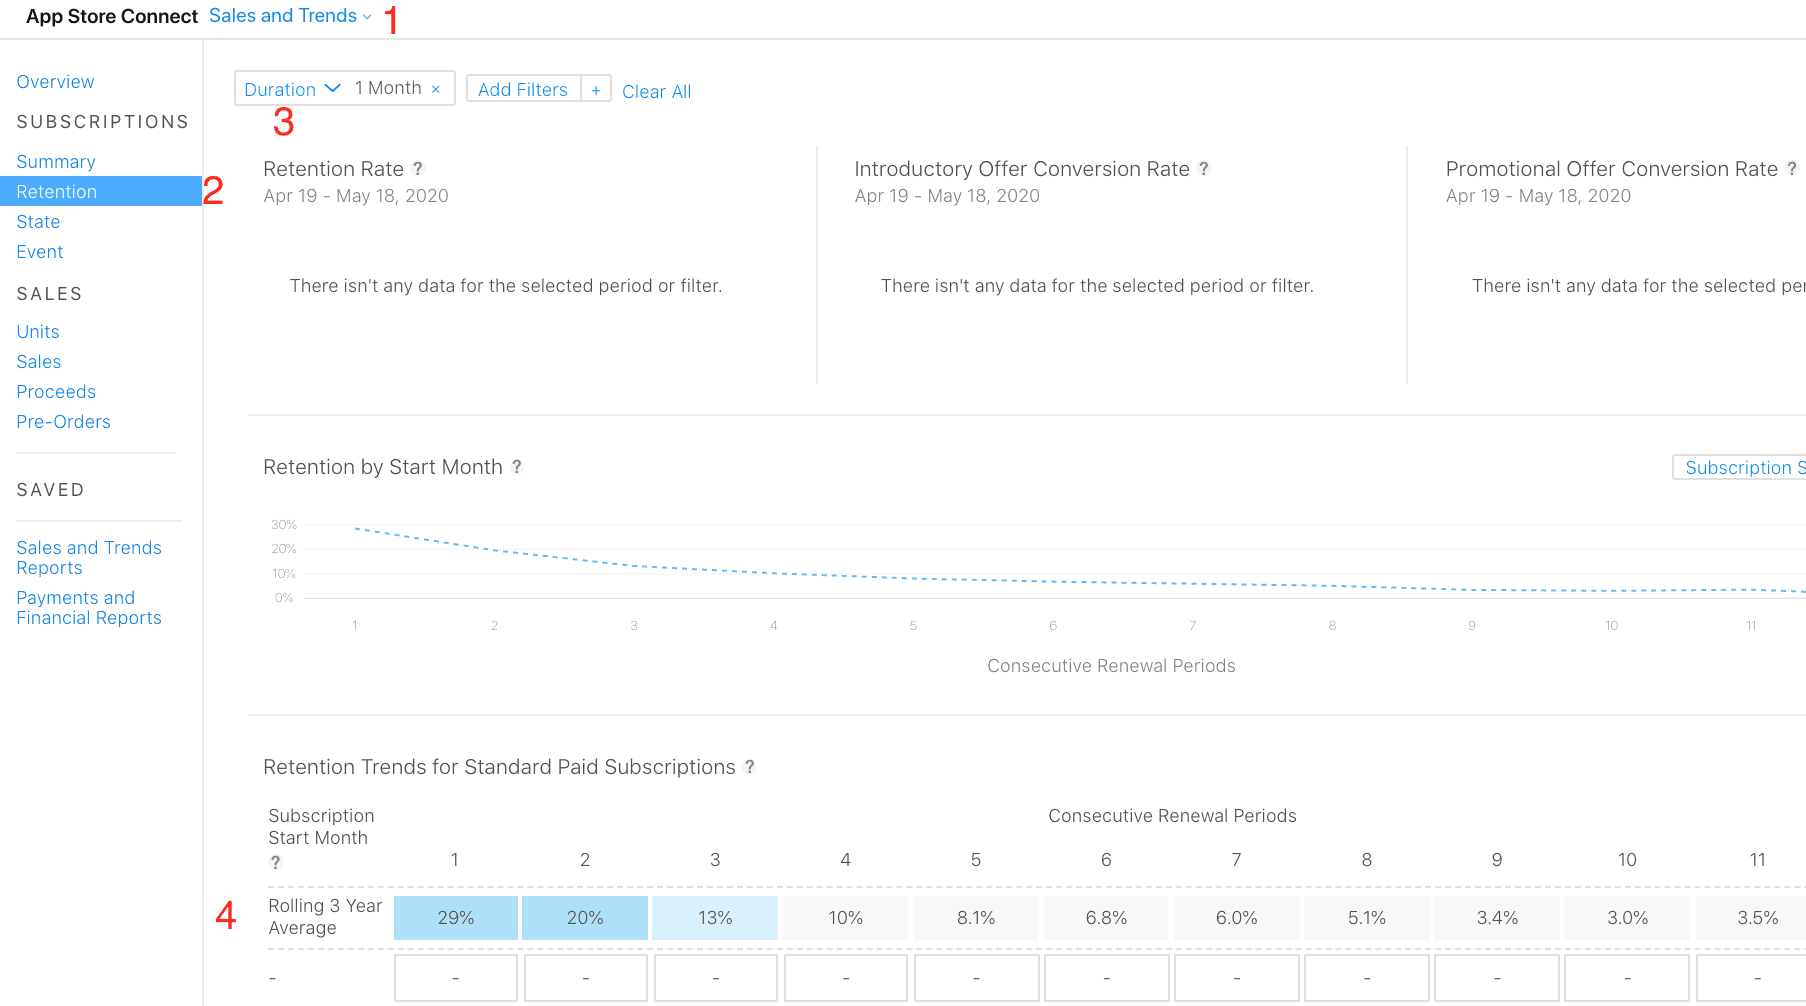
The first option is to plug in the percentage of users staying with the service each month. This is a perfect option if you have the actual historical data for your app. You can get the actual retention numbers from the App Store Connect Account for your iOS app. Here is how:
1) Go to your Sales and Trends section in the App Store Connect.
2) Navigate to the Retention tab on the left.
3) Choose a duration.
4) And there you have it: The table with the aggregated actual retention figures for the monthly subscription.
All that is left is to multiply the price of your monthly subscription by the monthly retention to get the LTV. See the attached spreadsheet (LTV_based_on_App_Store sheet) for more information. You can plug in the retention data from the App Store and the subscription price into the file and get your one-year LTV for the monthly subscription plan immediately.
Retention Curve Extrapolation
The second option is if you still need the actual retention numbers or just a few data points and want to forecast the retention into the future. In this case, you need to extrapolate the retention curve.
Some more complicated math happens here. The retention curve, as already mentioned, looks like this:
The following equation can describe this curve:
y = ax^b Here, x is a point in time (two months, three months, and so on), and y is the retention value you get at a given time. The variables a and b are constants for this curve. If you have actual data points on this curve, then Excel can solve this equation so you can get the a and b values.With *a *and b calculated, you have the equation, and by feeding x into the equation, you get the retention values. Once you have the retention numbers, you can quickly get to the LTV.
See the attached spreadsheet (LTV_Retention_Curve sheet) for more information. You can plug in the actual retention for three months and get a full-year forecast, or you can adjust the calculations to your needs based on your available data.
Summary
This is a quick overview of the subscription LTV and retention calculations. However, note that LTV and retention curves differ based on different user acquisition channels, geographies, and other factors. If you really want to analyze your marketing performance and find ways to improve it, you might need to slice the data into a large number of segments to analyze separately.
One of the reasons my co-founders and I started Qonversion.io was to make the lives of mobile entrepreneurs easier and allow them to eliminate Excel spreadsheets.
Qonversion.io is the mobile subscription analytics that gets data from SDK on the devices and through integrations with the App Stores. Qonversion handles the subscription revenue data, interprets it, and uses out-of-the-box integrations to send that information to marketing and analytical platforms like Facebook Ads, AppsFlyer, or Amplitude.
We are on a journey to help mobile app entrepreneurs build tools to solve their pain points, with accurate LTV forecasting being one of those.
If you are interested in the mobile app business and want to join us on this journey, try Qonverision.io today and let us know if you need help.

Michael
CEO at Qonversion
Michael leads Qonversion with a vision to help mobile apps maximize their subscription revenue.