If you’re working with mobile apps, tracking the key mobile app metrics is crucial for your business’s success. But the big question is: which mobile app performance metrics matter the most? You'll find the answers in this artiicle.
We’ve gathered the most essential mobile app performance metrics that will give you a clear picture of how your app is performing. By understanding these metrics, including app download metrics and in-app purchase metrics, you can fine-tune your strategies and boost customer retention. Whether it’s through a mobile app KPI dashboard or mobile app analytics, these will keep you on track.
Understanding Key Mobile App Metrics
Let us start with the most common metric formulas: DAU and MAU.
What is DAU?
DAU stands for Daily Active Users – a metric that shows how many individuals use your app daily. It tracks the number of unique individuals that use your app daily, without considering how many times they open the app or how many sessions they log within a 24-hour period. It’s a simple but powerful metric for understanding daily engagement.

What is MAU?
Similarly, MAU, or Monthly Active Users, measures the number of unique users interacting with your app over a month (or the last 30 days). Both DAU and MAU are essential mobile app KPIs that give you insights into how engaged your users are over different time frames.

Now that you know how to track active users, you might be asking, how do I calculate my revenue per user or determine the lifetime value of my customers?. Don’t worry, we’ll get to those, but first, let’s focus on two other critical application KPI examples: the Retention Rate and the Churn Rate. These will help you understand how well your app keeps users engaged over time.
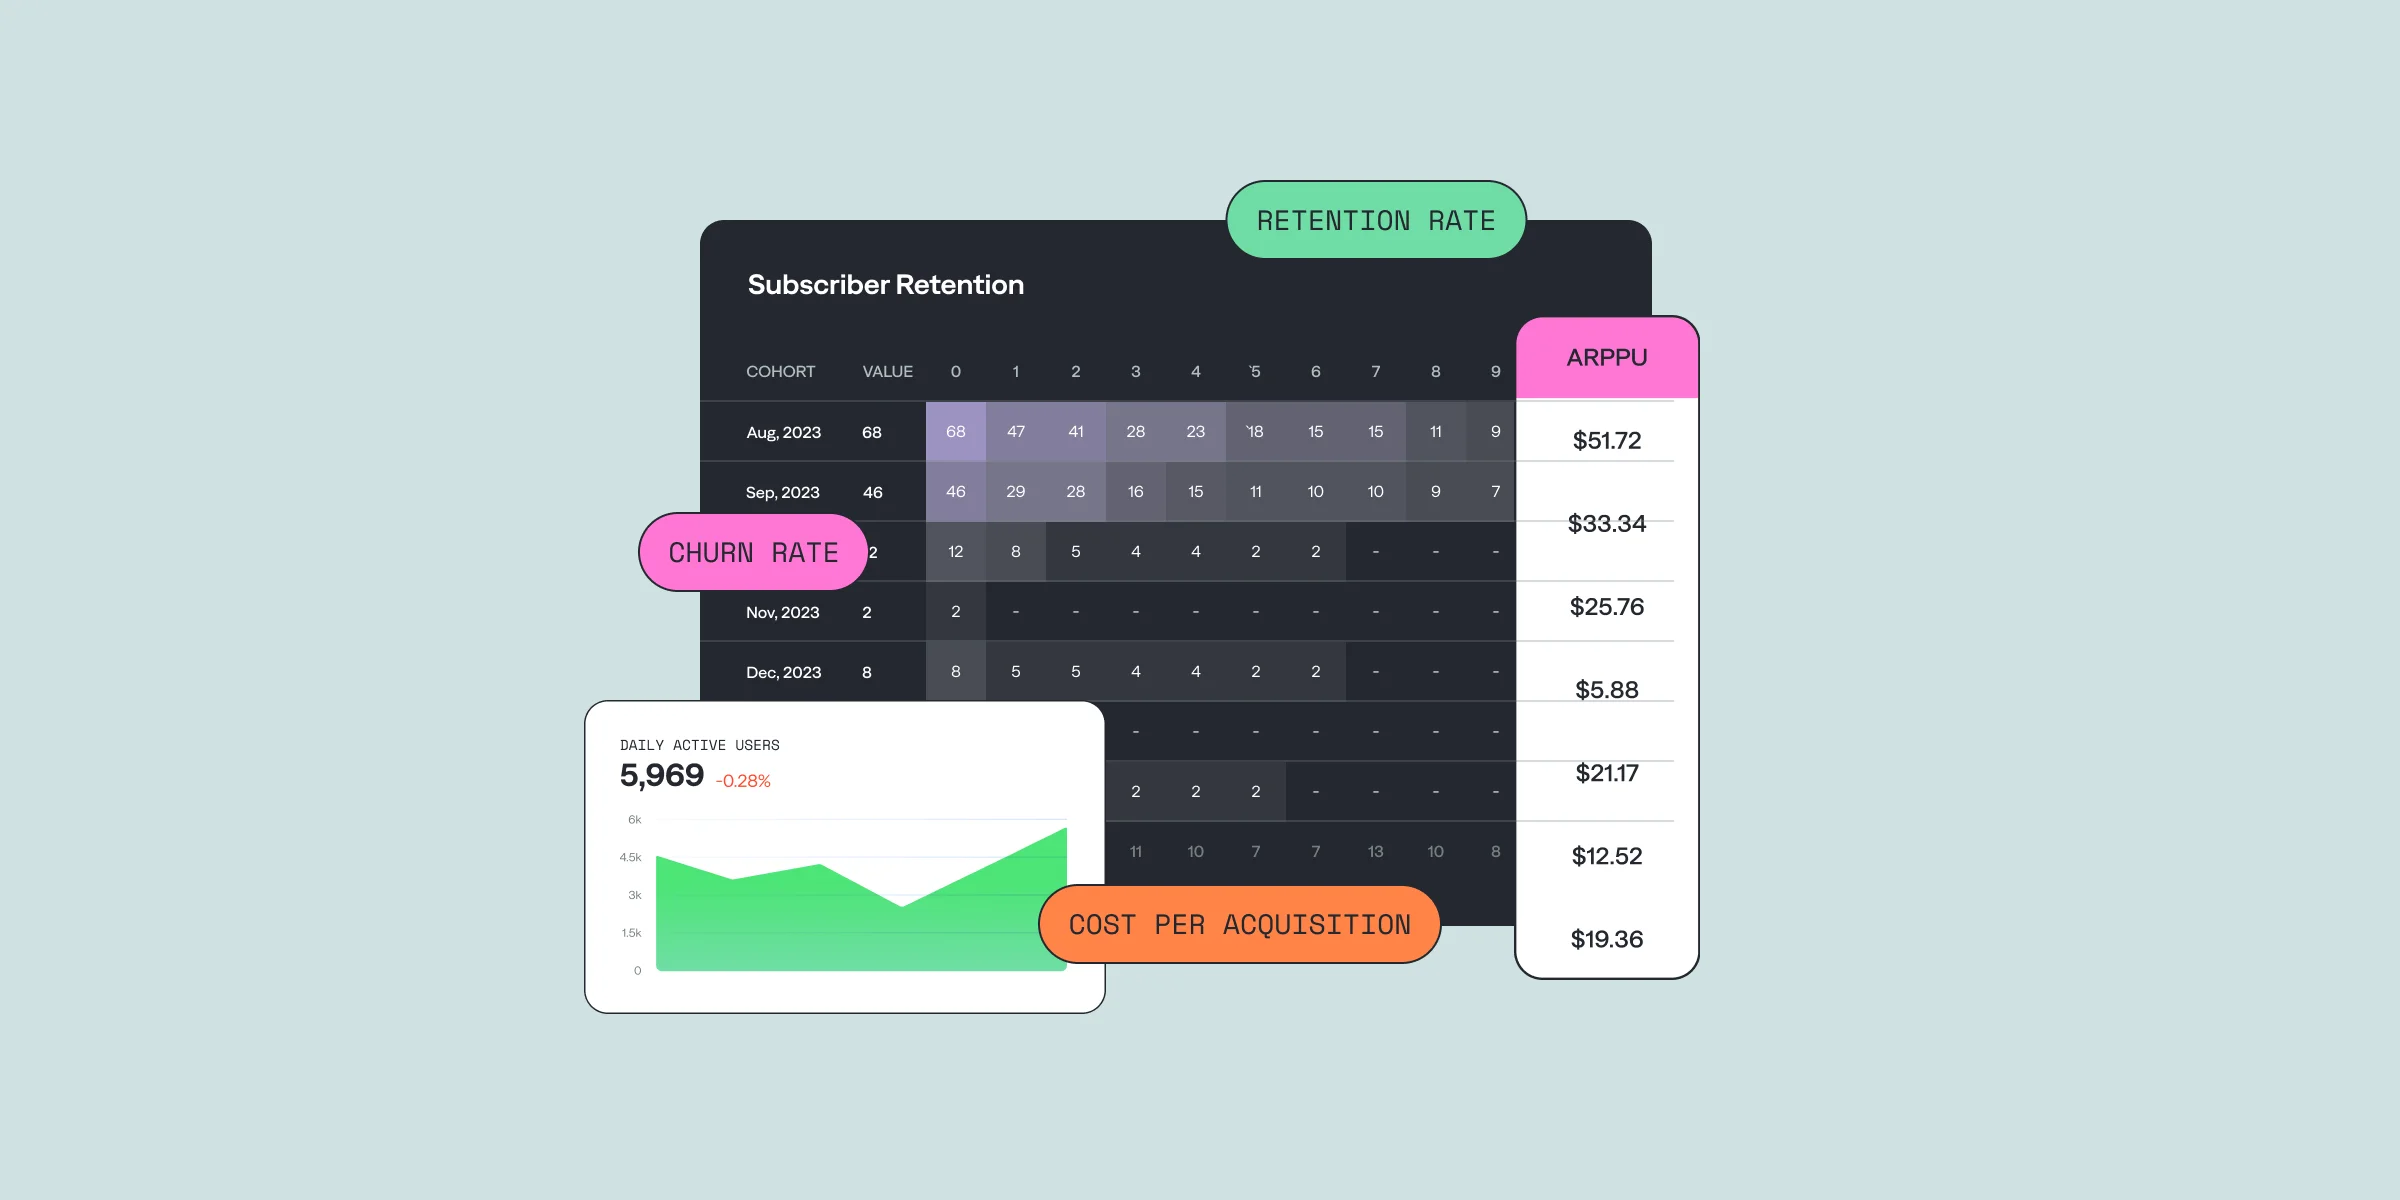
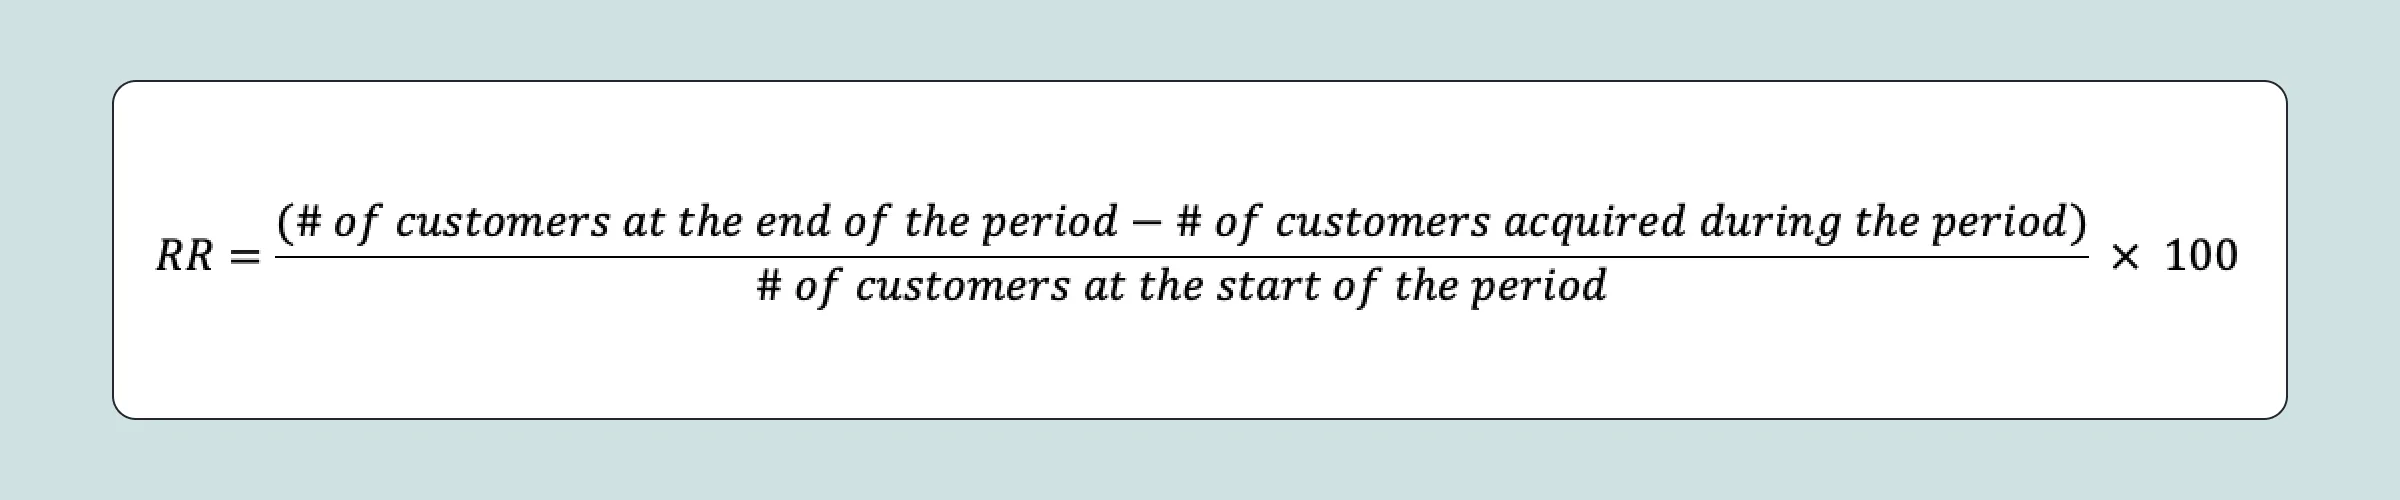
App Retention Rate
Retention rate measures how many users stay within the app over a specific period. Retention is critical because companies invest sales and marketing dollars in acquiring new users. Retention metrics can show whether an app needs to be modified or the last update was a success.
Churn Rate
The churn rate is the opposite of the retention rate and can be found by subtracting the RR from 1. Churn occurs when customers decide to delete the app, stop using the premium subscription, or downgrade to the free version. It is essential to remember that the Churn Rate is ALWAYS measured over a specific period.

Beyond retention and churn, understanding acquisition costs is also critical. Metrics like Cost Per Acquisition (CPA) and Customer Acquisition Cost (CAC) help measure how much it costs to acquire each user and assess whether your marketing strategies are cost-effective. These mobile app KPIs can be easily tracked through a mobile app KPI dashboard for a clear view of app performance and growth potential.
Cost Per Acquisition (CPA)
Cost Per Acquisition (CPA) calculates the total cost of getting a customer to take a specific action that could lead to a conversion. When your app has an established user base and you're focused on growth, CPA becomes one of the most important mobile app metrics to track. In essence, CPA helps determine if your marketing or campaign strategies are worth the investment. The lower your CPA, the better—because a high CPA often signals an underperforming campaign.

Customer Acquisition Cost (CAC)
On the other hand, Customer Acquisition Cost (CAC) focuses specifically on how much it costs to gain a new customer over a specific period of time. It’s a crucial metric for understanding your total marketing and sales expenses over a given period. Unlike CPA, which can measure actions like sign-ups or leads, CAC strictly measures the price of converting a lead into a paying customer.

CAC with LTV is a frequently compared metric in SaaS. It helps you see the company’s growth and expenses, predict future moves, and recognize areas for expansion.
Lifetime Value (LTV)
Lifetime value (LTV) asesses whether your customers generate enough value for the company before they decide to churn. Ideally, your LTV should exceed your Customer Acquisition Cost (CAC); otherwise, you risk losing money on each customer.There are multiple ways to approach LTV, but the main point is to determine how much profit you can expect from the average customer. The metric helps you balance the customer acquisition spend and determine the payback period's length. Learn all about calculating LTV and see examples here.

To make your life easier when calculating LTV, use Revenue Cohorts, which we perfectly explain here.
Subscriptions Cohorts
You should take a look at subscriber cohorts as well. Why are they useful? They allow you to see how long your app retains customers and divide subscribers into unique groups to use specific marketing tactics to improve your app performance and reach the KPIs. It’s crucial to not only focus on revenue cohorts. While your revenue may stay the same, the number of users can change, leading to lower or higher ARPU, an increase in churn, and other metric changes.
ARPU
A crucial mobile app KPI used in cohorts is ARPU. The abbreviation stands for Average Revenue Per User. This metric is linked to the customer’s lifetime value and allows you to see revenue per user since launch. Divide the total revenue by the number of users you’ve had.

Want to know how much revenue a paid user brings on average? Use the Average Revenue Per Paid User formula.

Recurring Revenue
Monthly Recurring Revenue (MRR) – an averaged monthly subscription revenue. MRR is mainly used to calculate the Net MRR Growth rate, which is the monthly increase in MRR. This app metric indicates the overall growth in revenue in SaaS businesses.

Summary
Having all these mobile app metrics laid out, it is important to remember that leveraging mobile app analytics and focusing on key metrics like ARPU and MRR can provide you with valuable insights into your app's performance. By understanding these, you can make informed decisions to enhance user retention, improve profitability, and drive growth in your mobile app business.
Frequently Asked Questions
Q: What is KPI in mobile apps?
A: KPI stands for Key Performance Indicator. In the context of mobile apps, KPIs are measurable values that help app developers and marketers assess the success of their applications. Common KPIs for mobile apps include user engagement, retention rate, and average revenue per user (ARPU).Q: What are the metrics for mobile app tracking?
A: Mobile app tracking involves several key metrics, including Daily Active Users (DAU), Monthly Active Users (MAU), Retention Rate, Churn Rate, Lifetime Value (LTV), and Average Revenue Per User (ARPU). These metrics provide insights into user behavior, app performance, and revenue generation.Q: How do you evaluate mobile app performance?
A: To evaluate mobile app performance, you need to analyze key metrics such as user engagement, retention rates, and revenue. Use tools like mobile app analytics platforms to track these metrics over time, allowing you to identify trends and areas for improvement.Q: How do you analyze a mobile app?
A: Analyzing a mobile app involves collecting and interpreting data from various metrics. Start by defining your KPIs and using analytical tools to track them. Look for patterns in user behavior, assess user feedback, and compare your app's performance against industry benchmarks to identify strengths and weaknesses.

Hena
Copywriter at Qonversion
Hena crafts compelling content about mobile app monetization and subscription optimization.