You can scroll around the map and zoom in on readings. Readings are continuously updated every few minutes. It displays the current ionizing radiation reading from these detectors on an easy to use world map, in uR/hr, one of the standard units of measurement for radiation. You can scroll around and zoom in to your area. Typical background (naturally occurring) radiation values near sea level are in the 10 to 20 uR/hr range. Higher readings naturally occur at higher elevations due to cosmic rays from outer space. Tapping on one of the readings will bring up a chart of the last few days worth of readings. You can even smooth out the variations by adjusting the number of samples averaged per plotted point, to bring out subtle variations. Buy a copy of Radiation Map Tracker, and you'll never be in the dark about nuclear radiation levels again.

Radiation Map Tracker displays worldwide radiation
View in App StoreRadiation Map Tracker displays worldwide radiation
4.6
Age Rating
4+
Seller
Black Cat SystemsGrow your in-app revenue
while we take care of your subscription management.
Mobile
SDK by Qonversion.
Price Intelligence based on:
213,518
apps aggregated
8,172,290
in-app prices defined
89
main categories
In-App Purchase Price (Subscription or Non-Recurring)
vs. average for the Weather category, $, by region
Build, analyze, and grow in-app subscriptions
with the most powerful mobile SDK for subscriptions
User Reviews for Radiation Map Tracker displays worldwide radiation
Decent app
Decent app allows you to zoom and scroll around the map to see what various readings are. I would give this a 5 if able to switch from map to satellite view. The ability to choose a radious around a certain location/current location to give push alerts if values raise more then a given amount would be most helpful. I want to thank the developers for reading the old reviews and listning to them making this app much better, thus my purchase of it!
Best Application
if can display the graph, black screen is shown up by tapping the circle.Is there any setting needed to display the graph?
Good mobile version of website
Those of you calling this a waste... You're idiots!!! Now pay attention: black cat systems makes hardware radiation detectors that interface w computers. This is not a government run service, it's strictly voluntary. When an owner of the hardware is testing the radiation level, it registers on a map for all to see. The more people testing, the more readings. This app is a mobile version of their map on the website, nothing more, nothing less and it's worth a buck for me to have access to the info. If there's no reading in your area do us all a favor and get some friends together, buy a monitor unit, connect it to your computer and let us all see what your readings are. Oh and I don't work for the company, I'm just a guy on the west coast concerned about the impending Fukushima disaster.
Poor app
Can see whole world and only a map of what appears to be outdated info.
Rad Map
I agree with other ratings that this is the best radiation map on the web. Dirt cheap too.
DO NOT BUY THIS APP!!!
This app is useless! Doesn't show accurate live data at all! Total ripoff! >:(
Heh
Quickest dollar I've ever blown.
Monitoring Glen Rose Plant
I started using this app while researching radiation exposure planning. With a nuclear plant nearby, I had discovered reports of high levels of over 300 for several days a few years back. The reports were from the public and stated even with multiple calls to the plant (one posing as a higher govt agency), no release of information was given out to the public. As I searched, this was the only option I found for real time monitoring. There were originally 2 sites right at the plant reporting. Those went away leaving only 1 in the DFW area.
Black Cat is Great!
Really nice radiation detector! And great that he made this app. I think the app should have a help file explaining what the units are. It doesn't explain this anywhere. And ability to show trends over time. Also would love color coding for levels. Everything is green but high numbers could be yellow/red. One reading of 213 still showed as green.
totally useless
unlike other apps from black cat this one is worthless. hitting the green circle just shows a black screen. As another reviewer mentionedthere are only a few site. I would have expected at the minimum around nuclear plants.
Description
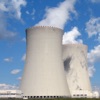
Concerned about nuclear radiation levels, due to fallout from damaged nuclear reactors, nuclear tests, or other events? Radiation Map Tracker connects to our extensive network of constantly updating, real time, nuclear radiation detectors, all run by volunteers, not government agencies. This app lets you determine what levels of radiation are being reported at various locations around the world.
More By This Developer


You May Also Like


POWER SUBSCRIPTION REVENUE GROWTH