Spectrogram Pro (with super-smooth 60Hz update)
View in App StoreSpectrogram Pro (with super-smooth 60Hz update)
3.8
Age Rating
4+
Seller
Dominik SeiboldGrow your in-app revenue
while we take care of your subscription management.
Mobile
SDK by Qonversion.
Price Intelligence based on:
213,534
apps aggregated
8,172,290
in-app prices defined
89
main categories
In-App Purchase Price (Subscription or Non-Recurring)
vs. average for the Music category, $, by region
Build, analyze, and grow in-app subscriptions
with the most powerful mobile SDK for subscriptions
User Reviews for Spectrogram Pro (with super-smooth 60Hz update)
Developers have removed key functionality
I purchased this years ago because it would display the electronic resonance carrier waves emitted by powerful RF emissions, like cell phone towers. Now, over the past year or so, the developers have deliberately removed these background resonance waves from being displayed; I can only guess why.I have emailed them twice with no response. I’m pretty sure they know what they did, and why.
Meh
It’s pretty good. It has a fast output, it reads sounds almost immediately. But there’s no playback and isolation option. I feel like that should be a basic feature in a pro version.
KILLER APP
I don’t know Bode from booty, but this is the most perfect frequency app for anyone, musician or not, to explore the world around them. Buy now.
Versatile real-time spectrogram
It is fast, with easy-to-read and adjustable scales, colors and gain. I also like the frequency cursors!
RPO
Programmers took away the 16-20kHz frequencies. Can no longer see the Easter eggs in movies.
Best app
Pinpointed exactly what I was I looking for in seconds
The best one..
The best spectrograph app, without a doubt.
Dangerous to leave open
This app isn’t bad. I use it every day. But it lacks some spit-n-polish that a “pro” app should have. For example you get one - ONE - guideline. You cannot demarcate a range, you can only target one single frequency. The most glaring problem though, is if you leave it running in the background, even in paused mode, it will ravage your battery. An iPad Pro that normally lasts weeks on a charge is completely discharged within 3 hours even though the app was in the background and the iPad put to sleep. SO BE CAREFUL!The last update was a year ago, so this is likely as good as it gets.
No IAA / AudioBus support
One of the nicest looking spectrograms around, unfortunately it only supports mic input. Does not work with AudioBus or AUM.
Great for finding frequencies
If you want to know if a high pitch squeal is coming from a device, this app is great for sniffing it out. Really fast update rate and UI response. Log vs linear is great for really dialing in higher or lower frequencies.
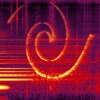
Description
Spectrogram Pro does a real-time spectral analysis of the sounds around you. You can use it for discovering hidden images in music, analyzing birdsongs or capturing that annoying high frequency whistling of your electronic device. You can choose between four FFT-resolutions, logarithmic or linear fequency and amplitude scale and four color-schemes and adjust the sensitivity.
More By This Developer


You May Also Like


POWER SUBSCRIPTION REVENUE GROWTH